|
Tables |
Tables contain not only statistical data, but associated documentation. The columns of the Tables represent the time series.
Plot Graphs Using the Data Available in a Table
You can use the data available in a Table to plot graphs (bar, line and scatter graphs). You can also plot a graph for specific columns and rows in a table, edit the settings for a graph (for example the X-axis label, Y-axis label and so on), specify the X-axis or Y-axis interval, and view multiple graphs that represent individual parameters of the Table on a single screen.
You can download an entire Table or the selected columns and rows of the Table, in Excel, with or without the documentation, save the Tables for future reference, and customize the appearance of the Table with selected columns, and rows or years.

Create Custom Tables
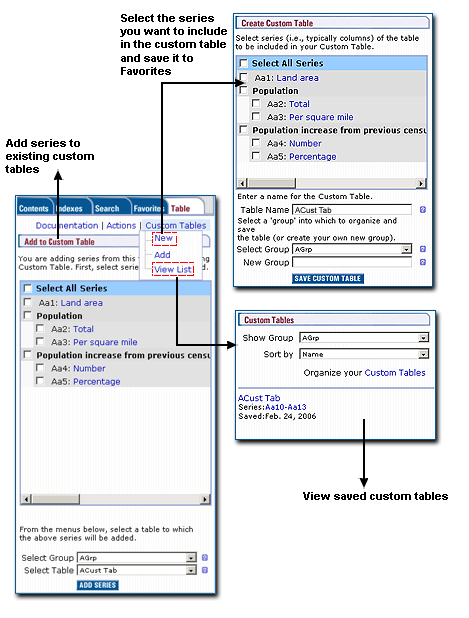
A powerful feature is the option to create a custom table. Select the series from different tables and merge them together to compare data from disparate tables.
Then, graph the custom table, or download it into Excel or CSV.

View Table Documentation and Definitions
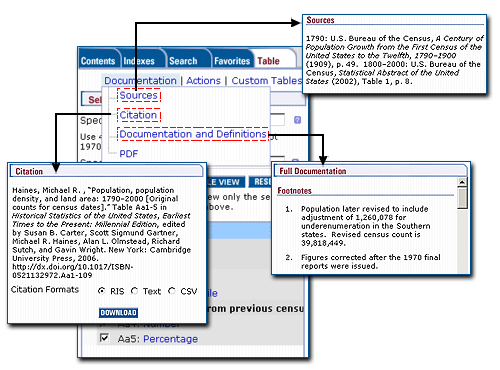
All tables include informative, extensive documentation and definitions to enhance your understanding of the Table data and how it was collected. These definitions were not included in previous versions of Historical Statistics in print or on CD-ROM.

Home | Contents | Indexes | Search | Favorites | Essays